Wine Exports in 2025: Who Held, Who Lost
Wines Export Editorial · Last updated:
Bruno Cantuária on Pexels
For an international buyer sourcing wine, 2025 was a year of broad contraction — but not an even one. The State of the World Wine Sector in 2025, published by the International Organisation of Vine and Wine (OIV) in May 2026, shows nearly every major exporting country losing volume, and in several cases value as well. For a buyer weighing supplier relationships and sourcing strategy for the year ahead, the country-level detail behind that headline number matters more than the aggregate figure itself.
The macro picture: production up, consumption and trade down
Start with the system-level numbers. Global wine production reached 227 million hectolitres (mhl) in 2025, up 0.6% year-on-year — a technical rebound rather than a sign of underlying strength. Global consumption fell to 208 mhl (-2.7%), continuing a structural decline in demand that has now persisted for years across most mature markets, from the US to Northern Europe.
On the trade side, the picture is starker: global wine exports fell to 94.8 mhl (-4.7% versus 2024), worth a combined €33.8 billion (-6.7%). Less wine changed hands internationally, and what did trade fetched proportionally less per unit — a sign that pricing pressure in export markets remained intense through the year, with no offsetting price effect cushioning the volume decline.
Global vineyard area continued to shrink as well: 7.0 million hectares in 2025, down 0.8%, the sixth consecutive year of contraction. Spain (919,000 hectares), France (740,000) and Italy (726,000) remain the world's three largest wine-growing countries by area, with the United States a distant fourth (415,000 hectares). This is not entirely bad news — much of the reduction reflects targeted removal of low-margin vineyards in mature European appellations — but it confirms the sector is in a phase of structural rationalisation rather than expansion.
The twelve leading exporters: the detailed picture
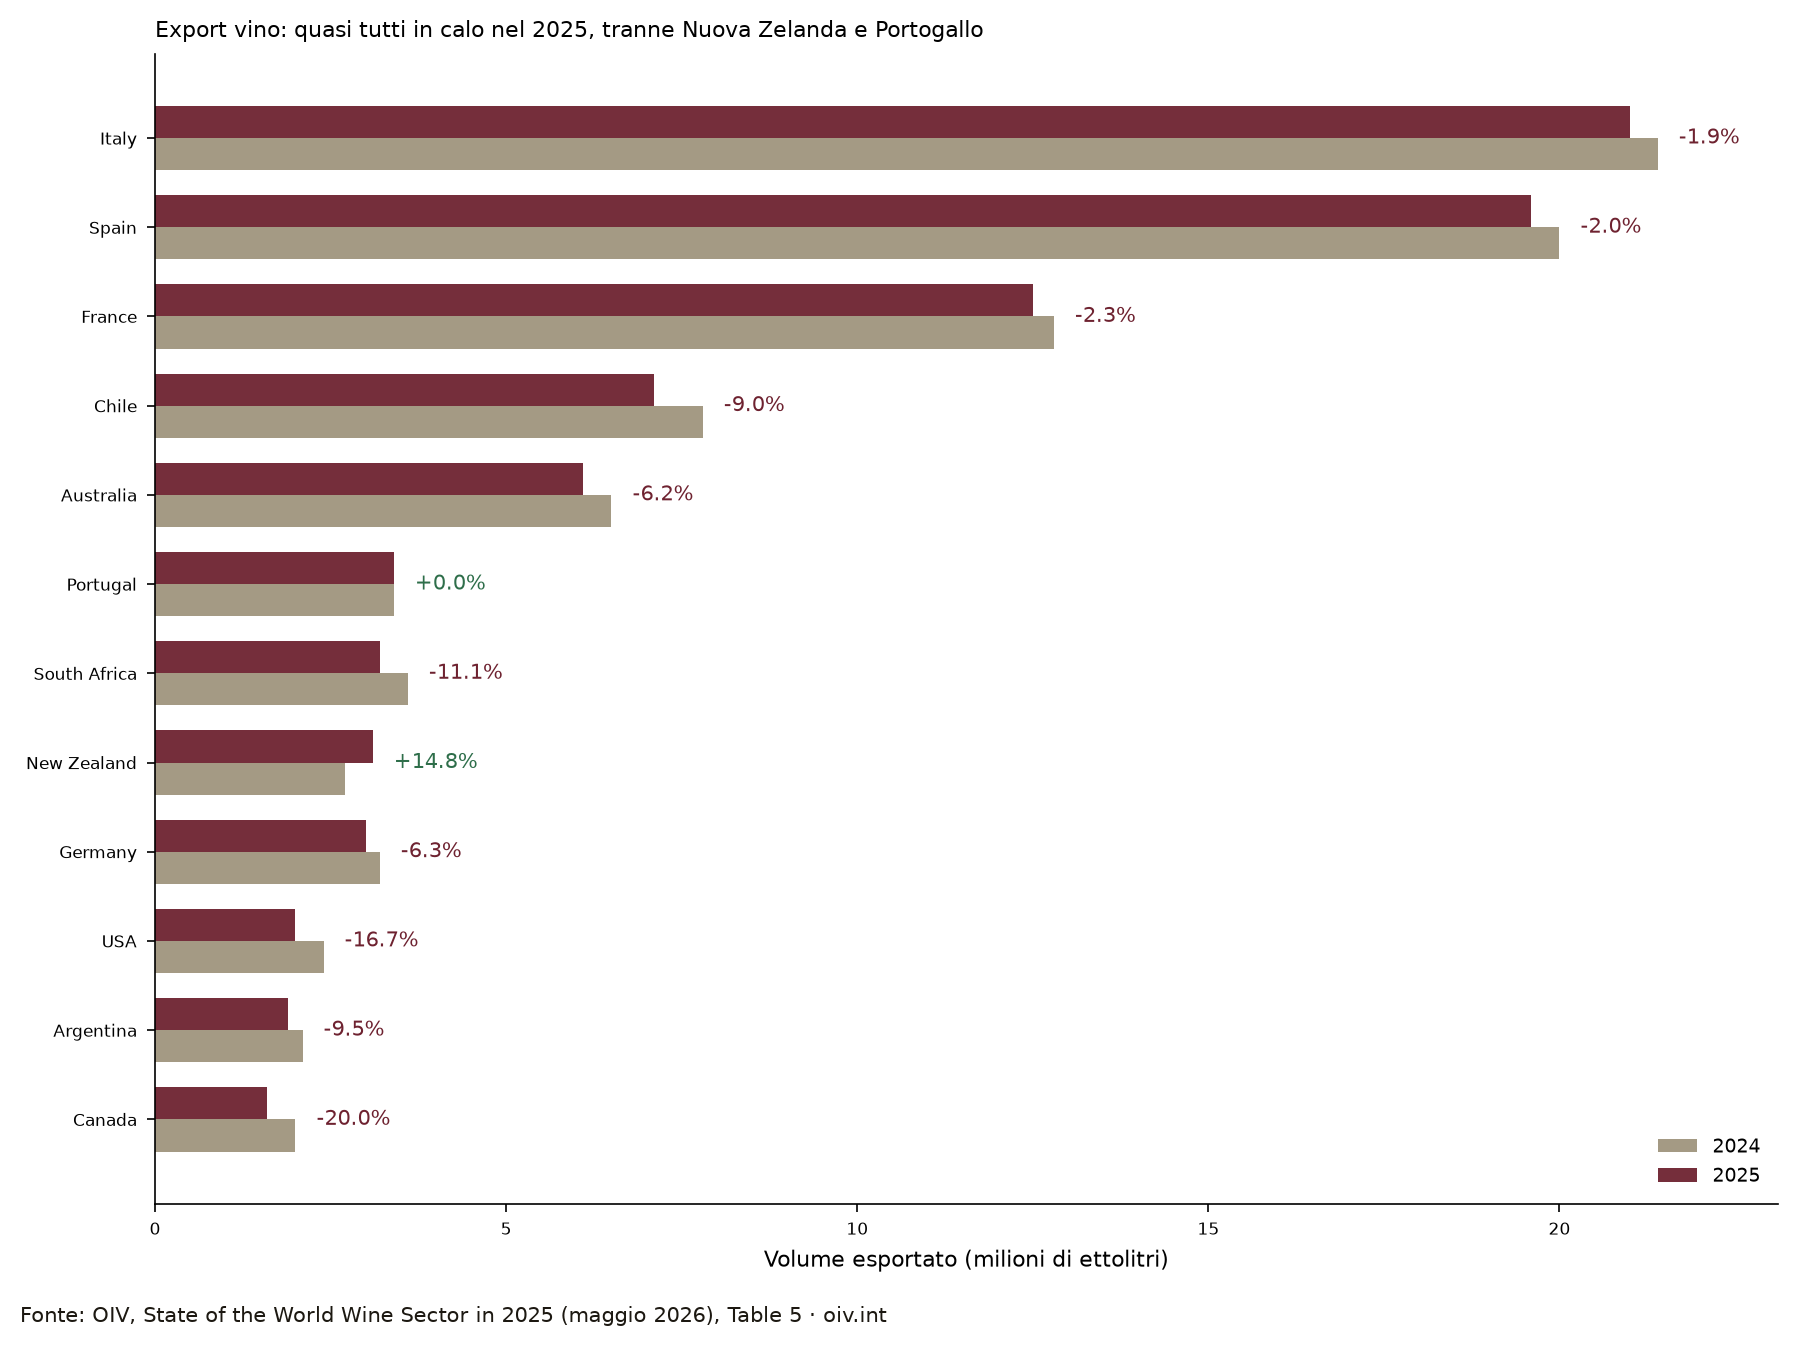
The number that matters most to a buyer is the country-level breakdown. Table 5 of the OIV report compares 2024 and 2025 export volume and value for the world's twelve leading wine exporters. The chart below summarises the volume shift:
Source: OIV, State of the World Wine Sector in 2025 (May 2026), Table 5.
Key reads for sourcing decisions:
- Italy: 21.0 mhl exported in 2025 (down from 21.4 mhl, -1.9%), worth roughly €7.8 billion (down from €8.1 billion). Italy remains the world's largest exporter by volume, but the wider gap between volume and value decline signals pressure on average selling prices.
- Spain: 19.6 mhl (down from 20.0 mhl, -2.0%), value down from €3.1 billion to roughly €3.0 billion. Spain continues to compete on high volume at a structurally lower average value per hectolitre than Italy or France.
- France: 12.5 mhl (down from 12.8 mhl, -2.3%), but retains by far the highest total export value among the three major European producers (over €11 billion) — confirmation of its premium and sparkling-wine positioning.
- Chile and Australia, the two leading Southern Hemisphere exporters, recorded the steepest declines among the historical "big" suppliers: Chile fell from 7.8 to 7.1 mhl (-9.0%), Australia from 6.5 to 6.1 mhl (-6.2%).
- South Africa: the sharpest percentage volume decline among the top ten, from 3.6 to 3.2 mhl (-11.1%).
- The United States: -16.7% in volume (from 2.4 to 2.0 mhl) and an even steeper value collapse (from €1.18 billion to €0.76 billion, roughly -36%) — arguably the single starkest data point in the report for anyone sourcing through or into the US market.
- Canada: the sharpest percentage volume decline of the twelve, -20.0% (from 2.0 to 1.6 mhl), off an already modest base.
The only two exceptions to the downward trend in the top twelve are Portugal, essentially flat in volume (3.4 mhl in both years) with a small value gain, and — more notably — New Zealand, which grew both in volume (from 2.7 to 3.1 mhl, +14.8%) and, critically, held its export value almost unchanged despite the volume increase — a sign that added supply was absorbed by demand without significant price discounting.
Volume vs. value: the real fault line of 2025
Looking only at volume paints a flat, predictable picture of decline. The real story of 2025 emerges from comparing the percentage change in volume against the percentage change in value: in most markets, value fell faster than volume, meaning average export prices declined rather than held. This is starkest for the United States, where a 16.7% volume drop came with a value collapse more than double that in proportional terms — a signal that goes beyond simple demand contraction, likely reflecting more aggressive promotional discounting, a shift in product mix toward lower price tiers, or tariff and logistics costs absorbed at origin rather than passed to the end consumer.
For a buyer, the takeaway is that suppliers who chased volume by cutting price in a contracting-demand year generally lost more value than those who didn't. The two countries that held or improved their value-to-volume ratio — Portugal and New Zealand — are precisely those that did not pursue volume at any cost.
What this means for sourcing decisions
Three practical implications follow from this data.
First, the broad-based decline was not uniform: New Zealand's performance shows that a focused positioning strategy and the right distribution channels can still generate growth even in a difficult system-wide year. This is a signal about what works when aggregate demand contracts — a clear value proposition and less reliance on price as the primary competitive lever.
Second, the widening gap between volume resilience and value decline — visible for Italy, Spain, and dramatically for the US — indicates that competition in export markets is increasingly fought on average price rather than absolute volume. For a buyer building a long-term supplier relationship, this means a producer's positioning (price tier, packaging, brand narrative) now matters more than simple shelf presence.
Third, the US export decline — the single most affected market by value among the twelve — deserves specific attention for any buyer whose sourcing or distribution strategy runs through the American market: the contraction reflects dynamics beyond base demand, including recent international tariff tensions, and reinforces the case for geographic diversification of supplier and distribution relationships rather than concentrating growth on a single destination market. Secondary but expanding markets — consistent with the New Zealand signal — merit closer evaluation in 12-18 month sourcing plans.
The limits of this data
It should be stated clearly: the OIV report captures full-year 2025 aggregated at country level. It does not break the figures down by channel (on-trade vs. retail vs. e-commerce), price tier, or specific appellation. For a more granular read on a given destination market, these figures still need to be cross-referenced with bilateral customs data (Istat, Eurostat Comext, or the importing country's own customs statistics) and, where available, channel-specific data for that market — a cross-reference that a structured export network with direct visibility into buyers and importers in individual countries can provide with a level of detail the OIV macro data alone cannot.
This article draws on the OIV State of the World Wine Sector in 2025 report (May 2026), institutional public-domain data. Wines Export tracks OIV updates quarterly and Istat/UIV Italian trade data monthly.
- Wine Freight Forwarders: Choosing the Right Logistics Partner for Export
- Optimizing Wine Exports with Wines Export CRM | Pricing Strategies for International Markets
- Wine Importer vs Distributor vs Broker: Who Buys What?
- Wine Distributors Germany: How to Find the Right Ones
- Wine Marketplace: How B2B Platforms for Selling Wine Abroad Really Work
- Customs Documents and Duties for Exporting Wine to Ukraine: An Operational Guide